Tap
In faucet manufacturing, real-time dashboards show how many sensor-controlled taps each assembly island produces and how many pass the final test. Errors become visible during the shift, not just in the evening.
Tap at a glance
Most frequent in the projects on this page
Users in these projects

Verified projects featuring Tap
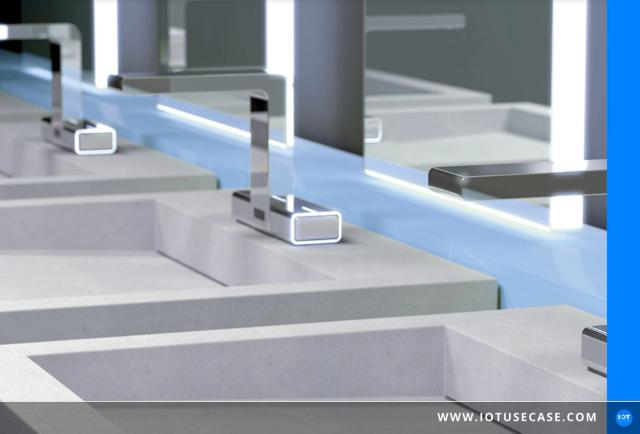



Faucet manufacturing with real-time dashboards
In the solution example, sensor-controlled taps are assembled by hand at 15 islands by up to three specialists. Each island has a tester who checks the electrical and mechanical components, leak tightness and the software and hardware of the finished product. The results are stored in an SQL database. Peakboard's operational excellence platform accesses this database directly, extracts the required data and shows it on displays. Errors can be classified as software, hardware or mechanical faults.
The user is Swiss company Aquis Systems AG, an OEM for electronic solutions in sanitary technology with 300 employees. Previously, test results were imported into an Excel spreadsheet, quantities and error rates were only known at the end of the working day, and updates often took several hours. With Peakboard, the data is available in real time and printed lists are no longer needed. Some parts shown as defective turned out to be fault-free once the dashboards were introduced. Dashboards show orders per island, degree of completion and pass and fail results for all sites. The first draft was running after a four-hour workshop. An andon board is planned that will show material availability and reorder automatically when stock runs low.
Faucet manufacturing: frequently asked questions
How can a faucet assembly line be made transparent?
A faucet assembly line becomes transparent when the test results of each island appear continuously on dashboards. At Aquis Systems, specialists assemble sensor-controlled taps at 15 islands, and the results are stored in an SQL database. Peakboard reads them directly and shows orders per island, degree of completion and pass and fail results. This allows the performance of individual islands to be analysed and compared.
What does faucet end-of-line testing cover?
The final test checks electrical and mechanical components, leak tightness and the software and hardware of the finished product. At Aquis Systems, each assembly island has its own tester. The results are documented in an SQL database. Using Peakboard's dashboards, faults can then be classified as software, hardware or mechanical errors and analysed in a targeted way.
How do results from a faucet leak test station feed back into production?
The results feed back in real time when a dashboard accesses the test database directly. At Aquis Systems, they used to be evaluated in Excel, and updates often took several hours. Today, Peakboard shows pass and fail results immediately. Employees and quality managers can review process quality together and derive improvements faster.
Which KPIs does a sensor faucet manufacturer need on the shop floor?
What matters are quantities, error rates and order progress, during the shift. With Peakboard, Aquis Systems shows the daily, weekly, monthly and annual output of all sites in real time. This is complemented by orders per island, degree of completion and pass and fail results. Previously, these figures were only available at the end of the working day.
More assets in “Piece Goods / Bulk Material”

Parcel
Parcel sorting with IoT starts in goods receiving, where sensors capture each parcel’s tracking number, size and weight. Shipments are routed by priority, packing teams know early what is coming, and manual scanning ends.

Workpiece
Manufacturing traceability assigns each workpiece its identifier, its position and all process and inspection data. Manufacturers can thus document every work step and detect quality deviations before scrap is produced.

Printed circuit board
PCB manufacturing digitalisation connects machines, controllers and the ERP so that every printed circuit board is produced with the right parameters. Manufacturers detect downtime and bottlenecks, avoid operating errors and give customers the production data they ask for.

Raw material batch
Batch management with IoT links every raw material batch to weighing data, test results and the production order. When deviations or audits occur, manufacturers see at once which batch went into which product instead of searching paper and Excel files.

Goods in transit
Cargo theft prevention starts with IoT trackers that report the position, temperature and shocks of goods in transit. They show shippers at all times where their goods are and reveal break-in attempts, delays or problems in the cold chain.

Injection-moulded part
Injection moulding defects often show up in cooling and process data before they become visible on the moulded part. IoT continuously records mould temperature, cooling water and machine data so that deviations are noticed before faulty parts are produced.
IIoT Use Case user group
What no project tells you
What did the project cost? Which sensor didn't survive in the field? How did you get maintenance on board? 300+ industrial users discuss questions like these with each other every month, openly and without vendors in the room.
Frequent topics in these projects, bring your questions:
- Condition Monitoring
- Digital Documentation
Online every month
Alternating tech and business focus
Users only
No sales pitches, exchange under NDA
300+ members
OT, IT and IIoT leads from industry